All guides
Creatives

Creative Analytics: which pictures and videos sell

Creative Analytics shows every ad from Meta (and TikTok when connected) side by side, judged on real store orders, not on what the ad platform claims. It is read-only.

Where: Menu → Creative Intelligence → Creative Analytics Plan: Profit, Grow and Scale
1

Choose period, platform and currency

Pick a Period (1) (Today, Yesterday, Last 7, 14 or 30 days, or Custom with From / To), a Platform and a Currency, then click Show.
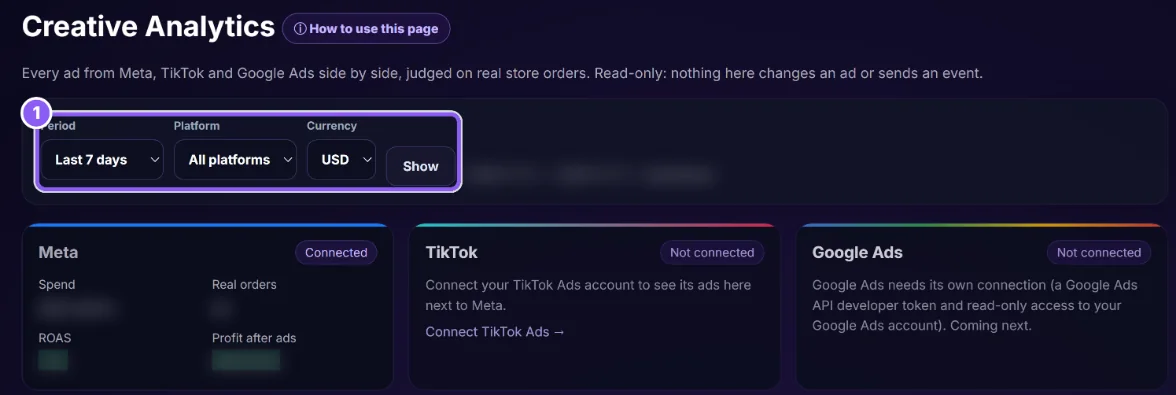

Choose period, platform and currency
Tap the picture to see it bigger. Private details are blurred.
2

Check connected platforms

Each platform shows Connected, Error or Not connected with its spend, real orders, ROAS and profit. Connect TikTok Ads opens TikTok Reporting. Google Ads is coming next.

3

Read the totals

Ad spend, Real orders (plus “likely” ones), Revenue from those orders, ROAS, Cost per order and Profit after ad spend. Under it: how many purchases the platforms claim.

Read the totals
Tap the picture to see it bigger. Private details are blurred.
4

Find winners to reuse

Winners to test on your other platforms lists creatives with at least 2 real orders and a ROAS at or above your overall ROAS.

5

Check creative diversity per ad set

The Ad sets table (2) shows each Meta ad set with its ads, spend, real orders, cost per order, ROAS, profit and Creative diversity (Low, Medium, High, with a score out of 100). Hover the label for details.

Check creative diversity per ad set
Tap the picture to see it bigger. Private details are blurred.
6

Compare every creative or ad

In All creatives switch between Per creative (all ads using the same picture or video added up) and Per ad. Columns: Impressions, Platform says, Spend, Clicks · CTR, Real orders, Revenue, Cost per order, Profit after ads.

What each number means

Real orders
Store orders that carry this exact ad’s ID (the same matching as the Ads Dashboard). Orders matched only to the ad set or campaign show as “+ N likely” and are not in revenue, ROAS or profit.
Platform says
The purchase count the ad platform reports for itself. It usually differs from real orders.
Cost per order
Spend ÷ real orders.
Profit after ads
The orders’ profit (as on the Ads Dashboard) minus ad spend. An ad with no real order shows minus its spend. TikTok has no product costs yet, so its profit shows “—”.
Creative diversity
How different the pictures in an ad set look (0 = the same picture, 100 = completely different). Low is under 35, Medium 35 to 59, High 60 and above. Low means people tire of the ads sooner: add different-looking ads. Pictures Meta can no longer download are left out.
— (dash)
A currency could not be converted safely, so no number is guessed.

Questions

Why do Arabic and English versions of one design score about 50?

Same layout, different text: the pictures look half alike.

Can I pause an ad from here?

No. Creative Analytics is read-only.