Read the top cards
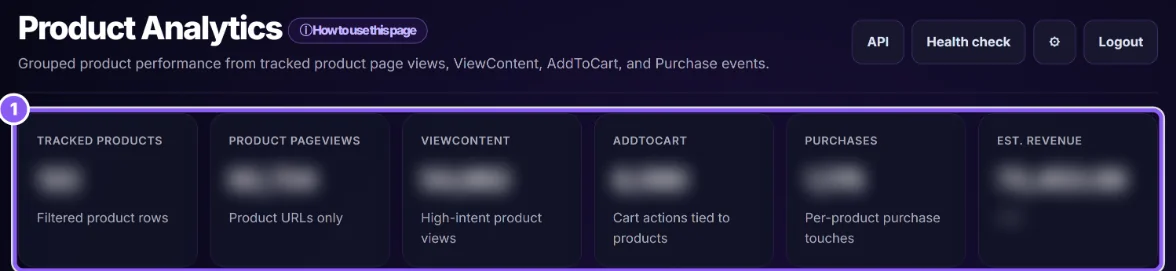
Tracked products, Product PageViews, ViewContent, AddToCart, Purchases and Est. revenue (1) for your filters.
 All guides
Product Analytics groups your store events by product: product page views, ViewContent, AddToCart and Purchase. It shows which products attract interest and which convert.
Tracked products, Product PageViews, ViewContent, AddToCart, Purchases and Est. revenue (1) for your filters.
Use Product search (ID, slug, path or URL), Status, Source, Date from / Date to, Rows per page, Sort by and Sort direction, and minimums (Min PageViews, Min AddToCart, Min Purchases). Click Apply filters; Reset clears them.
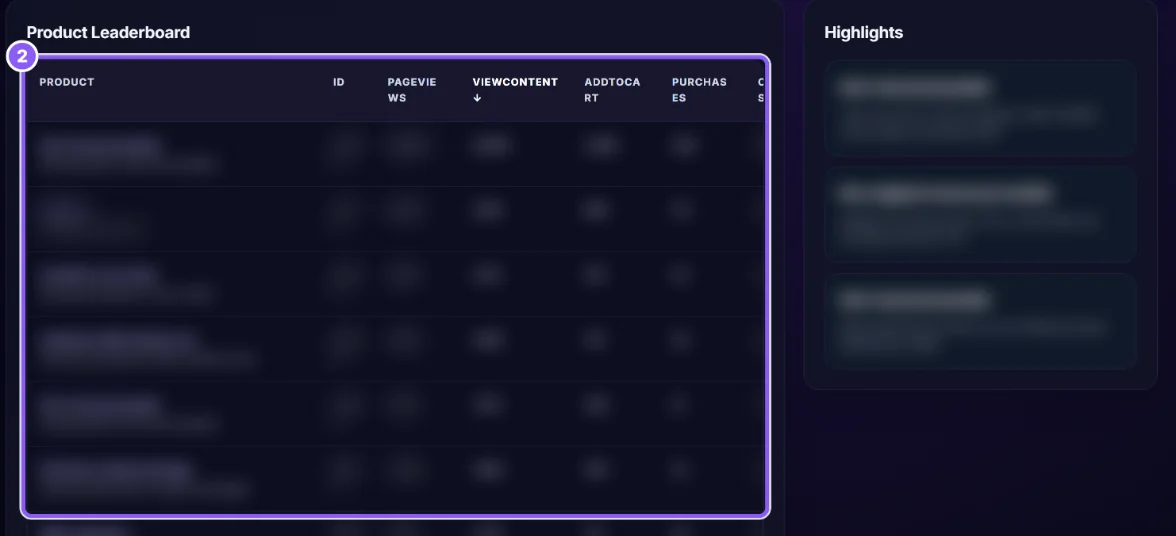
One row per product (2) with PageViews, ViewContent, AddToCart, Purchases, Orders, Est. Revenue, ATC Rate, Purchase Rate and Latest Activity. Use Prev / Next to page.
Click a product to open Product Details: its numbers, first and last seen, Open latest URL, and Recent Related Events. Back to products returns.
Highlights names the top product, the best converter (highest purchase rate) and the most carted product.
Check price, shipping and the checkout. Lost Buyers shows where people stop.